- →Why Does Traditional Equipment Commissioning Take 3–6 Weeks?
- →What Is Smart DOE and How Does It Replace Full Factorial Experiments?
- →What Does the Smart DOE Workflow Look Like in Practice?
- →How Much Faster Is Smart DOE Compared to Traditional Methods?
- →What Types of Equipment Benefit Most from Smart DOE?
Key Takeaway
Smart DOE powered by Bayesian optimization is designed to reduce semiconductor equipment commissioning from 3–6 weeks to 3–5 days, using up to 80% fewer test wafers (offline-lab validation; to be confirmed in a pilot on your data). In offline-lab validation on historical datasets, the NeuroBox E5200 reached Cpk ≥ 1.33 targets with as few as 10–15 wafers instead of the traditional 50–100 (Measured Offline-Lab; a validation target to reproduce on your tool), for modeled savings of $150K–$500K per qualification cycle computed from your wafer cost and tool count.
Equipment commissioning is one of the most expensive and time-consuming phases in semiconductor manufacturing. A single chamber qualification on a CVD or etch tool can consume 50–100 test wafers, tie up engineering resources for 3–6 weeks, and delay production ramp by months when multiplied across a fab’s tool fleet.
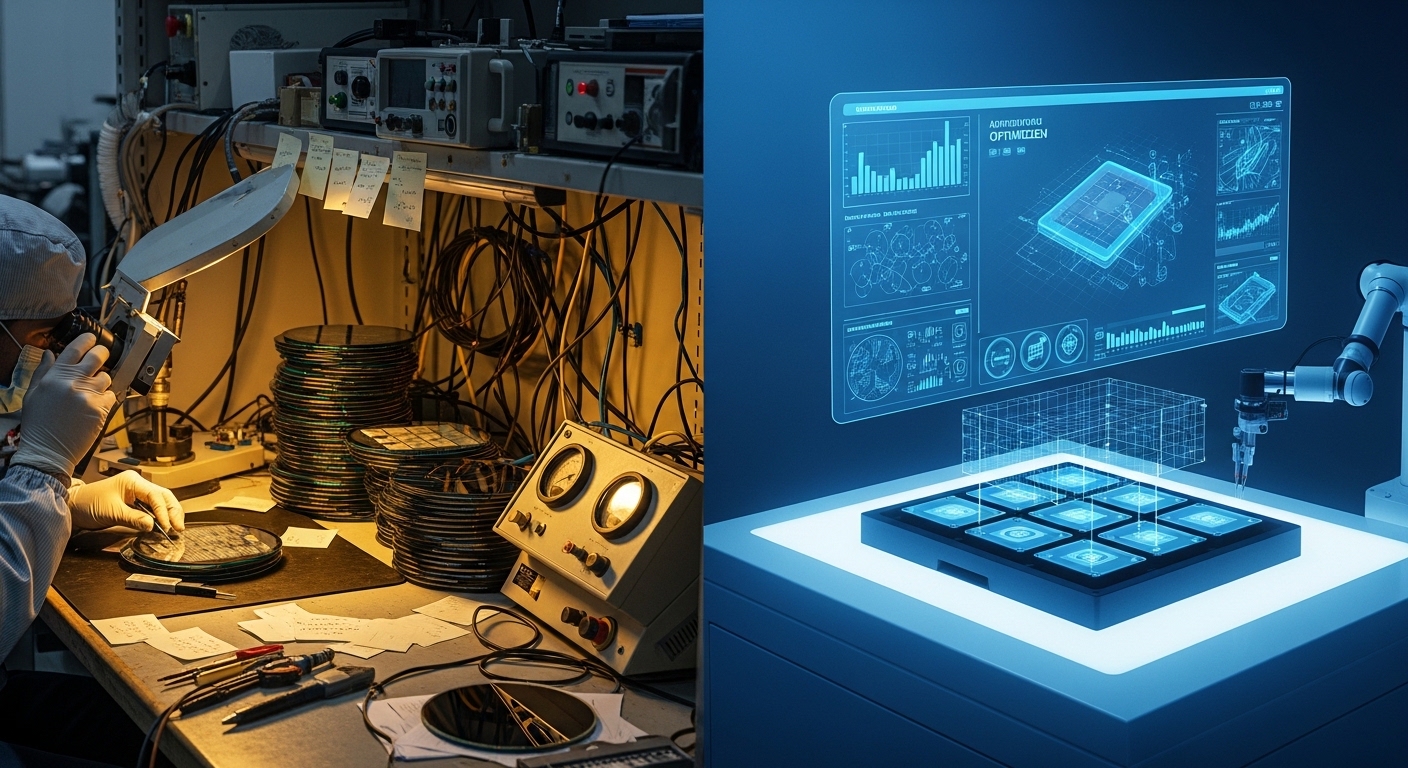
Yet most equipment OEMs and fabs still rely on the same commissioning methodology from the 1990s: full factorial DOE, one-factor-at-a-time experiments, and engineer intuition. The result is predictable — wasted wafers, blown schedules, and finger-pointing between equipment suppliers and fab integrators.
This article examines why traditional commissioning takes so long, what AI-driven approaches change, and how AI-guided DOE can cut qualification timelines by 70–85% (modeled / offline-lab validation).
Why Does Traditional Equipment Commissioning Take 3–6 Weeks?
Traditional commissioning follows a sequential process that compounds delays at every step:
- Baseline characterization (Week 1): Engineers run 15–25 wafers across parameter ranges to establish process windows. Each run requires metrology, data analysis, and team discussion before the next experiment is designed.
- DOE execution (Weeks 2–3): A full factorial or fractional factorial DOE with 5–7 parameters generates 32–128 experimental conditions. At 1–3 runs per day (limited by metrology queue time), this phase alone can consume 2–3 weeks.
- Optimization iterations (Weeks 3–4): DOE results rarely hit the target on the first pass. Engineers typically need 2–3 additional optimization rounds, each requiring 10–20 wafers.
- Qualification runs (Weeks 4–6): Once a recipe is identified, 25-wafer qualification lots must demonstrate repeatability. If Cpk falls below 1.33, the cycle restarts from optimization.
The total cost is staggering. For a 300mm fab commissioning a new etch tool, the math looks like this:
| Cost Component | Traditional | Smart DOE |
|---|---|---|
| Test wafers consumed | 80–120 | 10–20 |
| Wafer cost ($500–$2,000 each) | $40K–$240K | $5K–$40K |
| Engineering time | 120–240 hours | 20–40 hours |
| Tool downtime (lost production) | 3–6 weeks | 3–5 days |
| Total cost per tool | $200K–$500K | $30K–$80K |
For an equipment OEM delivering 20–50 tools per year, commissioning inefficiency translates to $4M–$25M in annual waste — not counting the competitive damage from delayed deliveries.
What Is Smart DOE and How Does It Replace Full Factorial Experiments?
Smart DOE replaces the static, pre-planned experimental design with an adaptive, AI-driven approach. Instead of defining all experiments upfront, the algorithm:
- Runs an initial small batch (3–5 wafers) to establish a prior model of the process response surface
- Uses Bayesian optimization to select the next experiment that maximizes information gain — focusing on the regions of parameter space most likely to contain the optimum
- Updates its model after each run with real metrology data, continuously narrowing the search space
- Terminates automatically when the predicted Cpk exceeds the target threshold (typically 1.33) with sufficient confidence
The key insight is that most of the parameter space in a traditional DOE is irrelevant — the process optimum occupies a small region, and a smart algorithm can find it without exhaustively testing every combination.
In practice, Smart DOE typically achieves target Cpk in 10–15 wafers compared to 50–100 for traditional methods — an 80% reduction in test wafer consumption.
What Does the Smart DOE Workflow Look Like in Practice?
The NeuroBox E5200 implements Smart DOE as a turnkey edge platform that connects directly to the equipment controller. Here is a typical commissioning workflow:
Day 1: Setup and baseline. Connect NeuroBox E5200 to the equipment via SECS/GEM or EtherCAT. Define target specifications (film thickness, uniformity, etch rate, etc.) and acceptable ranges. Run 3–5 baseline wafers to initialize the model.
Day 2–3: Adaptive optimization. The algorithm proposes experiments one at a time. After each wafer, metrology results are fed back (manually or via automated inline measurement). The system updates its Gaussian process model and proposes the next experiment. Typically 8–12 experiments are needed.
Day 3–4: Convergence and verification. Once the model predicts Cpk ≥ 1.33 with >95% confidence, it outputs the optimized recipe. A short verification lot (3–5 wafers) confirms the prediction.
Day 4–5: Documentation and handoff. NeuroBox E5200 automatically generates the qualification report — including all experimental data, model predictions, sensitivity analysis, and the final recipe with recommended control limits.
How Much Faster Is Smart DOE Compared to Traditional Methods?
Based on offline-lab validation on historical datasets across CVD, PVD, etch and diffusion tools (Measured Offline-Lab; to be confirmed in a pilot on your data):
| Metric | Traditional DOE | Smart DOE | Improvement |
|---|---|---|---|
| Test wafers per tool | 50–100 | 10–15 | 80% fewer |
| Time to qualified recipe | 3–6 weeks | 3–5 days | 85% faster |
| Engineering hours | 120–240 | 20–40 | 83% less |
| First-pass success rate | 40–60% | 90%+ | 2× higher |
| Typical Cpk achieved | 1.33–1.50 | 1.50–2.00 | Better optimum |
The first-pass success rate improvement is particularly important. In traditional commissioning, a failed qualification run means restarting the optimization cycle — adding another 1–2 weeks. Smart DOE’s higher confidence predictions dramatically reduce the probability of rework.
What Types of Equipment Benefit Most from Smart DOE?
Smart DOE delivers the highest ROI for equipment with:
- Multi-parameter processes (5+ tunable parameters) — where traditional DOE generates the most experiments
- Expensive test wafers — 300mm wafers at $1,000–$2,000 each make every saved wafer significant
- High tool volume — OEMs delivering 10+ identical tools per year multiply the savings
- Tight specifications — processes requiring Cpk > 1.67 where finding the optimum is harder
Common applications include CVD (PECVD, LPCVD, ALD), dry etch (RIE, ICP), PVD (sputtering), diffusion furnaces, and wet processing tools.
Can Smart DOE Work with Existing Equipment Controllers?
Yes. NeuroBox E5200 is designed as an edge device that sits alongside existing equipment without modifying the tool’s control system. It communicates via standard semiconductor interfaces:
- SECS/GEM (SEMI E5/E37): For recipe download, process data collection, and alarm monitoring
- EtherCAT / Modbus: For real-time sensor data acquisition
- Manual entry: For fabs that prefer offline metrology input
No modifications to the equipment controller firmware are required. The system is non-invasive — it recommends recipes, but the engineer makes the final decision to apply them.
What About Recipe Transfer Between Identical Tools?
One of the biggest pain points in equipment commissioning is tool-to-tool matching. Even identical tools from the same OEM exhibit chamber-to-chamber variation that makes direct recipe transfer unreliable.
Smart DOE addresses this with transfer learning. When commissioning the second (or tenth) identical tool, NeuroBox E5200 uses the optimized recipe from the first tool as its Bayesian prior. This means:
- The initial model already knows the approximate process landscape
- Only 3–5 delta experiments are needed to account for chamber-specific variation
- Second-tool commissioning typically completes in 1–2 days instead of 3–5
For OEMs shipping tool fleets, this compounds the savings dramatically. The 10th tool in a series may need only 3 wafers to qualify.
How Do You Get Started with Smart DOE?
MST offers a structured pilot program for equipment OEMs and fabs looking to validate Smart DOE on their specific processes:
- Process assessment — MST engineers review your current commissioning workflow and identify the highest-impact tool for a pilot
- Pilot deployment — NeuroBox E5200 is installed alongside the target equipment for a single commissioning cycle
- Results comparison — Side-by-side comparison of Smart DOE results vs. your traditional methodology on the same tool type
In offline-lab validation, Smart DOE reached roughly 80% fewer test wafers and 85% faster turnaround; reproducing this on your tool is the goal of a co-validation pilot (validation target). The pilot is designed to pay for itself in saved wafer costs alone.
Ready to see Smart DOE in action on your equipment? Book a 30-minute demo and we will walk through a modeled commissioning scenario for your industry segment.
Move from raw logs to replayable engineering evidence
Share the equipment type, legacy interface, target Host expectation and one representative incident or acceptance scenario. MST will review whether a private mapping, trace/replay or validation pilot is appropriate.
Request private evaluation →