- →What Does the Traditional P&ID to 3D Workflow Look Like?
- →How Does NeuroBox D Parse and Understand a P&ID?
- →How Does Component Matching Work at Scale?
- →What Makes AI-Driven 3D Layout Superior to Manual Placement?
- →How Does Automated Tube Routing Handle Real-World Complexity?
Key Takeaway
NeuroBox D provides a complete end-to-end workflow that transforms 2D P&ID schematics into fully assembled 3D SolidWorks models. The platform handles symbol recognition, component matching, spatial optimization, tube routing, and documentation generation — reducing a process that typically takes 5-10 engineering days to under 4 hours. This article walks through each stage of the automation pipeline with technical detail for design engineers evaluating the platform.
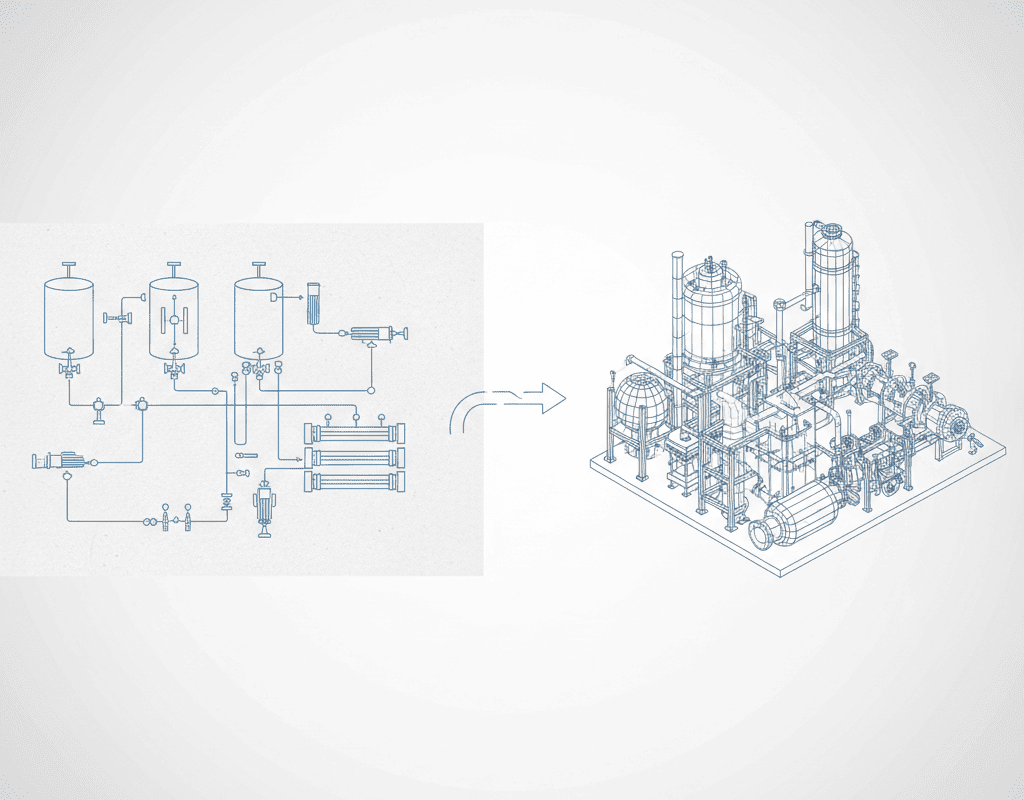
What Does the Traditional P&ID to 3D Workflow Look Like?
Every piece of semiconductor equipment starts as a schematic. Process engineers define the functional requirements — gas flows, chemical delivery sequences, pressure ranges, safety interlocks — and capture them in a Process and Instrumentation Diagram (P&ID). This document is the contract between the process team and the mechanical design team.
In the traditional workflow, a mechanical engineer receives the P&ID and begins a multi-day translation process. Industry benchmarks show the typical breakdown for a medium-complexity gas panel (40-80 components):
- P&ID interpretation and component identification: 4-8 hours
- Parts library search and 3D model retrieval: 3-6 hours
- Initial 3D layout and spatial positioning: 16-24 hours
- Tube and cable routing: 8-16 hours
- Interference checking and clearance verification: 4-8 hours
- Drawing generation and BOM creation: 4-8 hours
- Design review iterations: 8-16 hours
Total: 47-86 hours, or roughly 6-11 working days. For complex subsystems like multi-zone gas boxes with 120+ components, this figure can exceed 15 days.
NeuroBox D automates each of these stages. Here is how.
How Does NeuroBox D Parse and Understand a P&ID?
The automation pipeline begins when the engineer uploads a P&ID to the NeuroBox D platform. The system accepts multiple input formats: PDF, AutoCAD DWG/DXF, scanned images (PNG, TIFF), and native P&ID formats from tools like SmartPlant and AutoCAD P&ID.
NeuroBox Ds recognition engine uses a multi-layered computer vision approach:
Layer 1: Symbol Detection. A convolutional neural network trained on over 50,000 annotated P&ID sheets identifies standard ISA 5.1 and ISO 10628 symbols — valves (gate, globe, ball, butterfly, check, diaphragm), regulators, filters, gauges, transmitters, and flow elements. Detection accuracy is 97.3% on standard symbology and 94.1% on custom or company-specific symbols after fine-tuning.
Layer 2: Connection Topology. A graph neural network traces process lines between symbols, identifying the flow direction, branching points, and connection hierarchy. This layer distinguishes between primary process lines, utility connections, instrument signal lines, and pneumatic supply lines.
Layer 3: Annotation Extraction. Optical character recognition extracts tag numbers, size specifications, pressure ratings, material callouts, and notes. These annotations are linked to their corresponding symbols using spatial proximity analysis.
The output of this stage is a structured digital representation of the P&ID — a machine-readable graph where each node is a component with full specifications and each edge is a process connection with size and type information.
How Does Component Matching Work at Scale?
With the P&ID parsed into a structured format, NeuroBox D must map each abstract component to a specific physical part with a 3D model. This is where the platforms knowledge graph delivers significant value.
The NeuroBox D component database contains over 180,000 3D models from major component manufacturers including Swagelok, Parker Hannifin, Fujikin, CKD, SMC, and Festo. Each model is tagged with:
- Connection types and sizes (VCR, compression, weld, flange)
- Pressure and temperature ratings
- Material specifications (316L SS, Hastelloy, PTFE, PFA)
- Cv/Kv flow coefficients
- Dimensional envelope and mounting requirements
When the AI encounters a P&ID symbol tagged as “1/4 inch diaphragm valve, 316L SS, VCR connection, Cv 0.2,” it queries the knowledge graph and returns a ranked list of matching components. The ranking considers the companys historical purchasing data — if the organization has standardized on Swagelok 6LVV series for this application, that part is prioritized.
For companies with proprietary or custom components, NeuroBox D supports custom library ingestion. Engineers upload their SolidWorks part files, define connection points and metadata, and the system incorporates them into the matching algorithm. A typical onboarding process imports 500-2,000 company-specific parts within the first week.
What Makes AI-Driven 3D Layout Superior to Manual Placement?
The spatial layout stage is the most computationally intensive and the area where AI provides the greatest advantage over human designers. NeuroBox D must position 40-120 components in 3D space while satisfying dozens of simultaneous constraints:
Hard constraints (violations are not permitted):
- Minimum clearance between components (typically 15-25mm for service access)
- Maximum tube length between specific components (for dead volume minimization)
- Orientation requirements (regulators upright, check valves with correct flow direction)
- Safety separation distances (purge lines from process lines)
- Mounting point compatibility with the frame or enclosure
Soft constraints (optimized but flexible):
- Minimize total tube length (reducing gas volume and cost)
- Group components by functional subsystem for maintainability
- Align components on grid planes for visual consistency
- Position frequently serviced components at accessible heights
- Minimize the number of tube bends (reducing pressure drop)
NeuroBox D solves this optimization problem using a proprietary algorithm that combines constraint satisfaction with generative design. The system first learns layout patterns from the companys historical assemblies — typically 50-200 reference assemblies are needed for robust pattern learning. It then generates candidate layouts, scores them against the constraint set, and iteratively refines the best candidates.
The result is a layout that a human engineer would recognize as well-designed — because it was trained on designs that human engineers created and approved. But the AI generates it in minutes rather than days, and it evaluates far more layout alternatives than any human could consider.
How Does Automated Tube Routing Handle Real-World Complexity?
After components are placed, NeuroBox D routes process tubing between connection points. Tube routing in semiconductor equipment is particularly challenging because of:
- Tight spacing: gas panels often have 20-50mm between parallel tube runs
- Bend radius constraints: standard 1/4 inch electropolished tubing has a minimum bend radius of 6.35mm
- Orbital weld accessibility: weld heads require 50-80mm clearance around each weld joint
- Slope requirements: some lines require specific slope angles for drainage
- Thermal considerations: heated lines must maintain clearance from temperature-sensitive components
The routing algorithm uses a modified A* pathfinding approach with 3D obstacle avoidance. It processes routes in priority order — primary process lines first, then utility connections, then instrument tubing — and dynamically updates the collision model as each route is placed.
For a 60-component gas panel, the system typically generates 80-120 tube routes in under 10 minutes, with automatic bend calculation, cut length specification, and weld point identification. Manual routing of the same panel would require 8-16 hours of engineering time.
What Outputs Does NeuroBox D Generate for Manufacturing?
The final stage of the automation pipeline produces manufacturing-ready documentation:
3D Assembly File: A native SolidWorks assembly (.sldasm) with fully mated components, named features, and organized feature trees. The file follows the companys CAD standards for layer naming, color coding, and assembly structure.
2D Assembly Drawings: Automatically generated orthographic projections with dimensions, callouts, section views, and detail views. Drawing templates are customizable to match the companys title block and annotation standards.
Bill of Materials: A complete BOM with part numbers, descriptions, quantities, manufacturer information, and lead time estimates. The BOM exports to Excel, ERP-compatible CSV, or directly to SAP/Oracle via API integration.
Tube Cut List: Individual tube specifications including length, bend angles, bend positions, and weld joint locations. This document feeds directly into tube fabrication — whether manual or CNC bending.
Design Validation Report: An automated check against all constraint rules, flagging any violations, near-misses (within 10% of minimum clearance), or non-standard configurations that require human review.
The complete output package enables a downstream manufacturing team to begin fabrication without additional engineering interpretation. For organizations pursuing digital thread initiatives, NeuroBox D also generates STEP and JT neutral format files for PLM integration.
From P&ID upload to manufacturing-ready output, the entire workflow executes in 2-4 hours — with the engineer reviewing and approving the AI-generated design rather than creating it from scratch. This is not incremental improvement. It is a fundamental redesign of the engineering workflow, and it is available today.
Still designing assemblies manually?
NeuroBox D converts your P&ID into a complete SolidWorks assembly — in hours, not days. See how it works with your own designs.
See how NeuroBox D converts P&ID to native SolidWorks assemblies in hours, not weeks.