- →How Much Engineering Time Does Manual P&ID Review Actually Consume?
- →What Types of Errors Persist Despite All This Review?
- →What Is the Downstream Cost of P&ID Errors?
- →How Does AI-Powered P&ID Analysis Work?
- →What Results Are Companies Seeing From Automated P&ID Review?
Key Takeaway
Manual P&ID review in semiconductor equipment companies consumes an average of 142 engineer-hours per project and still misses 12–18% of errors that propagate to 3D design. Automated P&ID analysis using AI-powered tools like DrawingDiff can reduce review time by 75% while improving error detection rates to above 95%.
How Much Engineering Time Does Manual P&ID Review Actually Consume?
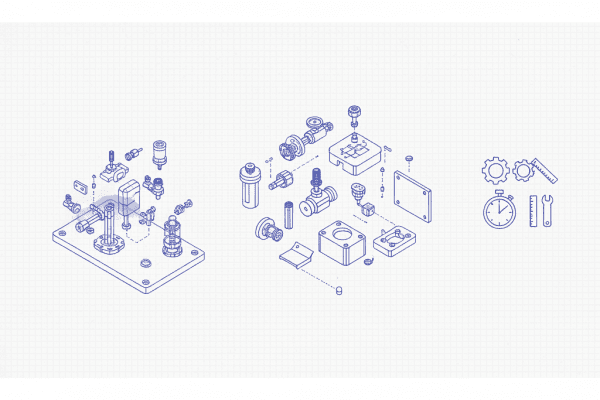
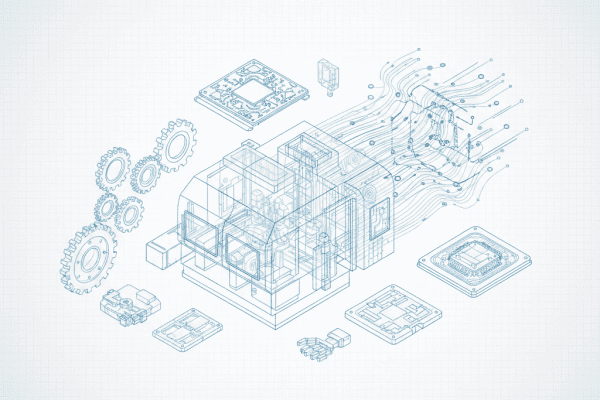
Piping and Instrumentation Diagrams are the foundational documents in semiconductor equipment design. Every valve, every sensor, every flow path, every safety interlock originates in the P&ID. When errors exist in these diagrams — and they always do — they propagate downstream into 3D mechanical design, BOM generation, procurement, and ultimately into physical hardware that must be reworked in the field.
To understand the scale of the problem, consider the review workflow for a typical semiconductor equipment P&ID package. A gas delivery system for a CVD or etch tool typically contains 8–15 P&ID sheets, each with 40–80 individual symbols, 60–120 connection lines, and 20–40 instrument callouts. The total information density across the package is substantial: a 12-sheet P&ID set contains approximately 2,400–3,600 individual elements that must be verified for correctness.
Industry benchmarking data from a 2024 study covering 53 equipment OEMs in Taiwan, South Korea, Japan, and the United States reveals the following time allocation for P&ID review:
Initial design review (process engineer): 24–40 hours. The process engineer who authored the P&ID performs a self-check against the customer’s process requirements, verifying that all process flows are correctly represented, safety interlocks are complete, and instrument specifications match the process conditions.
Cross-functional review (mechanical, electrical, controls): 32–48 hours. Mechanical designers review for buildability and spatial feasibility. Electrical engineers verify instrument I/O counts and power requirements. Controls engineers check interlock logic and sensor placement. Each reviewer examines the same diagrams through a different lens.
Customer review cycles: 40–64 hours. Customers — typically process engineers at semiconductor fabs — review the P&ID package against their facility standards, process recipes, and safety requirements. This review often involves multiple rounds of markup, clarification, and revision. The average number of customer review cycles is 2.4, with each cycle requiring 16–28 hours of engineering time from both the OEM and customer sides.
Revision incorporation and re-verification: 16–32 hours. After each review cycle, changes must be incorporated and the entire package re-verified to ensure that fixes did not introduce new errors. This is where fatigue-related oversights are most common.
Total: 112–184 hours per project, with a median of 142 hours. For a company executing 40 equipment projects per year, P&ID review alone consumes approximately 5,680 engineer-hours annually — equivalent to 2.8 full-time senior engineers doing nothing but reviewing diagrams.
What Types of Errors Persist Despite All This Review?
The uncomfortable reality is that even 142 hours of review does not catch all errors. A comprehensive error analysis conducted across 287 completed equipment projects from seven OEMs found the following residual error rates after manual review:
Symbol-to-specification mismatches: 4.2% residual rate. The P&ID shows a specific valve type (e.g., pneumatic diaphragm valve) but the process conditions actually require a different type (e.g., bellows-sealed valve for toxic gas service). These errors occur because reviewers check that a valve exists at the correct location but may not verify that the valve specification matches the process conditions at that specific point.
Missing or incorrect instrument ranges: 6.8% residual rate. Pressure transmitters specified for 0–100 psi when the process operates at 120 psi under certain conditions. Flow meters sized for steady-state flow but inadequate for transient conditions during recipe transitions. These errors are particularly insidious because they may not manifest until specific process recipes are run.
Connectivity errors: 3.1% residual rate. Lines that appear connected on the diagram but represent physically impossible connections (e.g., crossing flow paths that should not intersect). Missing connections where a line terminates without reaching its intended destination. These errors are difficult to catch visually because P&IDs are dense documents where lines frequently cross.
Safety interlock gaps: 2.7% residual rate. Missing emergency shutoff valves on toxic or flammable gas lines. Incomplete purge sequences. Pressure relief paths that dead-end or route to incorrect destinations. These errors carry the highest consequence — they affect SEMI S2 certification and, more importantly, operator safety.
Revision synchronization errors: 5.4% residual rate. When P&IDs undergo multiple revisions, changes on one sheet may affect other sheets. A valve added on Sheet 3 may require a corresponding instrument callout on Sheet 7 and a new interlock definition on Sheet 12. Manual tracking of cross-sheet dependencies is error-prone, and these synchronization failures are the most common category of residual error.
The aggregate residual error rate of 12–18% means that roughly one in six to one in eight design elements contains an error that survives the entire manual review process. Each of these errors has a downstream cost when it is eventually discovered — whether during 3D design (cheapest to fix), during assembly (more expensive), or during commissioning at the customer site (most expensive).
What Is the Downstream Cost of P&ID Errors?
The cost of fixing an error escalates dramatically depending on when it is caught. Industry data follows a well-established 1-10-100 rule, adapted for equipment manufacturing:
Error caught during P&ID review: $150–400 to fix. A markup on the diagram, a revision cycle, and re-verification. Minimal impact on schedule.
Error caught during 3D design: $1,200–3,500 to fix. The 3D model must be modified, interference checks re-run, and drawings updated. If the error affects component selection, procurement may need to be adjusted.
Error caught during assembly: $8,000–25,000 to fix. Physical parts may need to be replaced, tubing re-routed, and the assembly partially disassembled. Shop floor time is expensive and schedule impact is immediate.
Error caught during commissioning at customer site: $35,000–120,000 to fix. Field service engineers must be dispatched, parts shipped (often by air freight to meet schedule), and modifications made in a cleanroom environment with stringent contamination controls. The customer’s production schedule may be affected, triggering penalty clauses.
Using the residual error rates above and the cost multipliers for each detection stage, a single equipment project with 12 P&ID sheets carries an expected rework cost of $28,000–65,000 from errors that survive manual review. Across a company executing 40 projects per year, this represents $1.1M–2.6M in annual rework costs — a direct and largely invisible tax on engineering productivity.
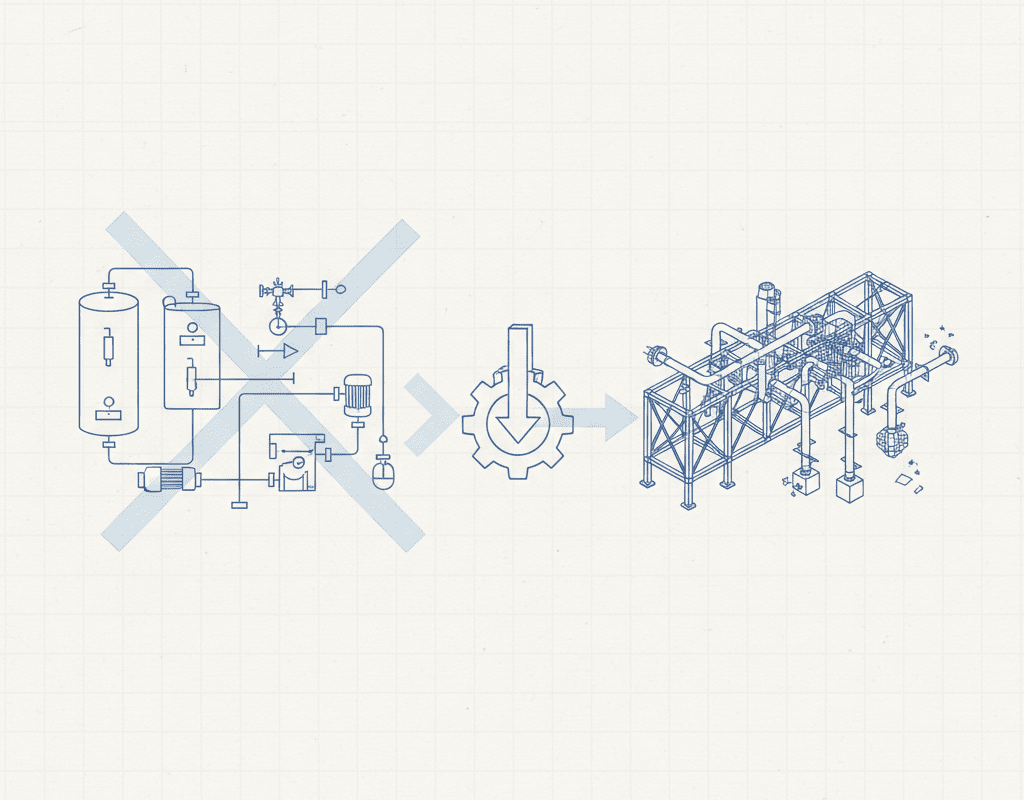
How Does AI-Powered P&ID Analysis Work?
Automated P&ID analysis combines several AI technologies to perform comprehensive, systematic review at speeds impossible for human reviewers:
Symbol recognition and classification. Computer vision models trained on P&ID symbol libraries (ISA 5.1, customer-specific standards) identify and classify every symbol on the diagram. Modern object detection models achieve 98.5–99.2% accuracy on standard P&ID symbols and can be fine-tuned to recognize company-specific or customer-specific symbol variants.
Connectivity tracing. Graph extraction algorithms trace every line from source to destination, identifying all connection points, branches, and crossings. This produces a machine-readable representation of the flow network that can be analyzed for completeness and correctness.
Rule-based validation. Engineering rules are encoded as automated checks: every toxic gas line must have a pneumatic shutoff valve, every pressure vessel must have a relief device, every instrument must have a specification that matches its process conditions. These rules can encode SEMI standards, customer requirements, and company-specific design standards.
Cross-sheet consistency verification. The AI analyzes all sheets in a P&ID package as an integrated whole, verifying that every off-page connector has a matching destination, every instrument tag is unique, and every change on one sheet is reflected on all related sheets.
Tools like DrawingDiff extend this capability to revision comparison — automatically identifying every difference between two versions of a P&ID and classifying each change as intentional (matching a change order) or unintentional (a potential error). This is particularly valuable during the customer review cycles where multiple rounds of revision create opportunities for synchronization errors.
What Results Are Companies Seeing From Automated P&ID Review?
Early adopters of AI-powered P&ID analysis report significant improvements in both efficiency and quality:
A Japanese equipment manufacturer specializing in wet processing tools implemented automated P&ID analysis across 23 projects in 2024–2025. Results: review time decreased from an average of 156 hours to 38 hours per project (76% reduction). Error detection rate improved from 84% to 96.3%. The number of errors reaching the 3D design phase dropped from an average of 14.2 per project to 2.8 per project.
A Taiwanese gas system OEM with 180 active P&ID templates deployed AI-powered revision comparison to manage their customer review cycles. They reduced revision-related errors by 89% and shortened the average customer review cycle from 3.2 iterations to 1.8 iterations — because fewer errors in the initial submission meant less rework.
A multinational equipment company used automated cross-sheet validation on a complex cluster tool P&ID package containing 34 sheets. The AI flagged 47 cross-sheet inconsistencies in 12 minutes — a task that had previously required 3 senior engineers working for 2 full days.
How Should Engineering Teams Implement Automated P&ID Review?
Adopting AI-powered P&ID analysis is not a rip-and-replace exercise. The most successful implementations follow a phased approach:
Phase 1: Parallel validation (months 1–3). Run AI review in parallel with existing manual review. Compare results to build confidence in the AI’s accuracy and identify gaps in its rule set. This phase is about calibration, not replacement.
Phase 2: AI-first review with human verification (months 4–8). Use AI analysis as the first-pass review, with human reviewers focusing their time on items flagged by the AI and on judgment-intensive checks that require process knowledge. This reduces human review time by 60–70% while maintaining or improving detection rates.
Phase 3: Continuous validation (months 9+). Integrate AI analysis into the design workflow so that P&IDs are validated continuously as they are created — not just at formal review milestones. Errors are caught minutes after they are introduced, when they are cheapest to fix and the designer’s context is fresh.
The investment case is straightforward. A company spending 5,680 engineer-hours per year on P&ID review and incurring $1.5M in rework costs from residual errors can expect to recover 4,000+ engineer-hours and reduce rework costs by 70–85% within the first year of full deployment. At a fully-loaded engineering cost of $120/hour, the productivity recovery alone is worth $480K annually — before counting the rework savings.
Manual P&ID review was the best available approach when diagrams existed only on paper and in CAD files that could not be machine-read. That era is ending. Equipment companies that continue to rely exclusively on human eyeballs to catch errors in their most critical engineering documents are accepting a level of risk and inefficiency that is no longer necessary.
Related Reading
Still designing assemblies manually?
NeuroBox D converts your P&ID into a complete SolidWorks assembly — in hours, not days. See how it works with your own designs.
NeuroBox D generates native SolidWorks 3D assemblies from P&ID in 4 hours. Auto BOM, zero errors.
Book a Demo →See how NeuroBox reduces trial wafers by 80%
From Smart DOE to real-time VM/R2R — our AI runs on your equipment, not in the cloud.
Book a Demo →