- →What Types of Design Errors Escape Manual Review Most Often?
- →How Does DrawingDiffs 3D Model Comparison Engine Work?
- →How Does the 2D Drawing Overlay Detect Changes That Humans Miss?
- →How Does P&ID Cross-Validation Prevent Specification Mismatches?
- →What Does the DrawingDiff Output Report Look Like?
Key Takeaway
DrawingDiff uses three AI-powered comparison engines — 3D model differencing, 2D drawing overlay analysis, and P&ID cross-validation — to detect design discrepancies with 99.2% accuracy, compared to 54-68% for manual engineering review. By catching dimensional errors, missing annotations, revision propagation failures, and P&ID-to-assembly mismatches before they reach manufacturing, DrawingDiff prevents downstream rework that costs equipment companies an average of $2-8 million annually.
What Types of Design Errors Escape Manual Review Most Often?
Engineering review is a human cognitive task, and human cognition has systematic blind spots. Understanding which error types escape manual review most frequently is essential for evaluating automated detection tools.
A comprehensive study conducted across five semiconductor equipment OEMs analyzed 2,400 design errors that reached manufacturing or field installation over a 3-year period. The errors were categorized by type and the stage at which they were eventually detected:
Small dimensional changes (38% of escaped errors). The most common category involves dimensions that changed between revisions by small amounts — 0.1-2.0mm on features sized 50-500mm. These changes are within the visual noise threshold for human comparison and are routinely missed during side-by-side drawing review. A typical example: a mounting hole pattern shifted by 0.5mm between Revision C and Revision D to accommodate a component change, but the change was not flagged in the revision notes and was not detected until assembly.
Tolerance and GD&T modifications (22% of escaped errors). Changes to tolerance values, datum references, or geometric controls are dense with information and cognitively demanding to compare. A position tolerance that changed from 0.05mm to 0.10mm, or a datum reference that shifted from -A-B-C- to -A-C-B-, can have significant functional implications but occupies only a few characters on a crowded drawing.
Added or removed annotations (17% of escaped errors). When a note, surface finish symbol, or weld callout is added to or removed from a drawing, the change affects a small area of a large document. Engineers scanning a familiar drawing often fail to notice the absence of an annotation that was present in the previous revision — a classic change blindness phenomenon.
P&ID-to-drawing inconsistencies (15% of escaped errors). When the P&ID is updated but the corresponding assembly drawings are not revised to match (or vice versa), the result is a specification mismatch between the functional definition and the physical design. These cross-document errors are particularly difficult to catch because they require simultaneous review of two different document types.
BOM and drawing conflicts (8% of escaped errors). Discrepancies between the bill of materials and the drawing — wrong part number in the BOM, mismatched quantity, or missing item — cause procurement and manufacturing confusion. These errors are tedious to check manually and are often deprioritized during time-pressured reviews.
How Does DrawingDiffs 3D Model Comparison Engine Work?
DrawingDiffs first comparison layer operates directly on 3D CAD models, providing the deepest level of geometric analysis. This capability is unique to DrawingDiff — most drawing comparison tools operate only on 2D outputs.
The 3D comparison engine ingests two versions of a SolidWorks assembly (or STEP/JT neutral format files) and performs a multi-level analysis:
Geometric Differencing. The engine compares the solid geometry of every part in both assembly versions, identifying added material, removed material, and shape changes. The comparison operates at a resolution of 0.01mm, detecting modifications that would be invisible on a printed 2D drawing. The output is a color-coded 3D visualization where unchanged geometry is gray, added material is green, removed material is red, and modified surfaces are highlighted in yellow.
Assembly Structure Comparison. Beyond individual part geometry, the engine compares the assembly structure — identifying added components, removed components, replaced components (different part in the same position), and repositioned components (same part in a different location). For each change, the system reports the affected component, the nature of the change, and the magnitude of any position or orientation shift.
Interference Analysis Delta. The engine runs interference detection on both assembly versions and compares the results. If Revision B introduces a new interference that did not exist in Revision A, this is flagged as a potential design error. Conversely, if Revision B resolves an interference that existed in Revision A, this is noted as an improvement. The delta analysis catches clearance problems that arise from the interaction of multiple changes — a class of errors that is extremely difficult to detect through visual inspection.
The 3D comparison processes a typical 60-component gas panel assembly in under 3 minutes. For large assemblies with 200+ components, processing time extends to 8-15 minutes — still orders of magnitude faster than manual comparison.
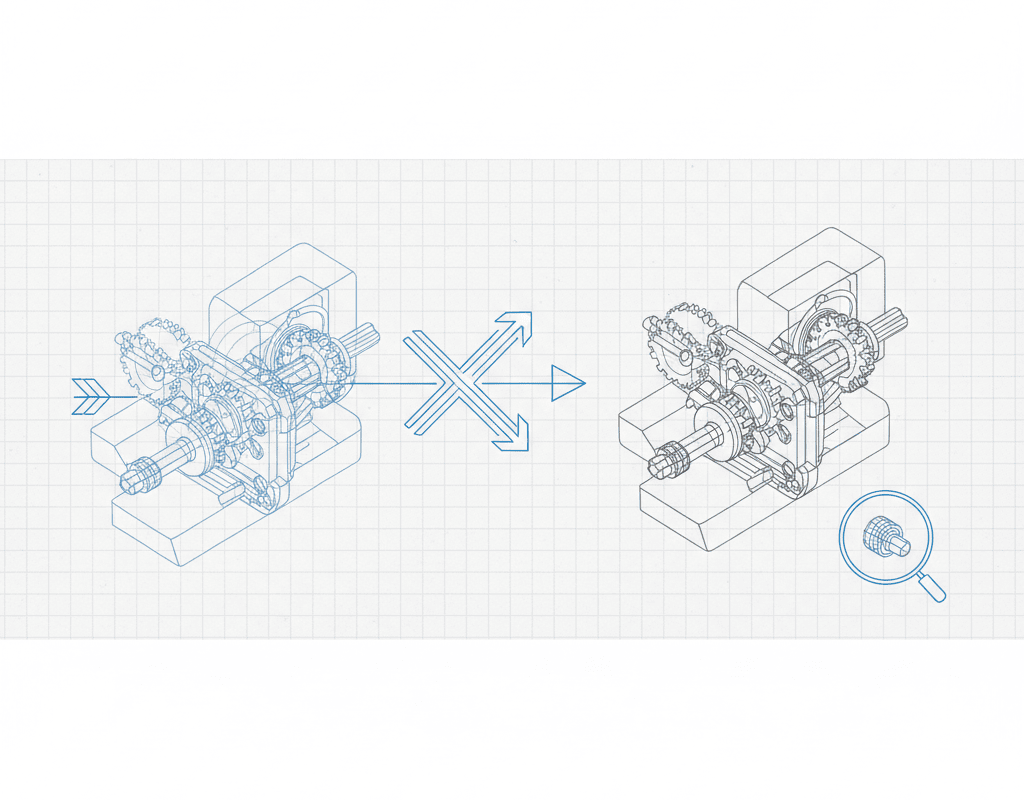
How Does the 2D Drawing Overlay Detect Changes That Humans Miss?
DrawingDiffs second comparison layer operates on 2D engineering drawings — the format that manufacturing, procurement, and quality teams primarily work with.
The 2D analysis engine performs five parallel comparison operations:
Intelligent Pixel Overlay. Both drawing revisions are rasterized at high resolution (600 DPI equivalent) and aligned using a multi-point registration algorithm that compensates for sheet-level variations (slight shifts in title block position, different plotter calibrations). The overlay identifies every pixel-level difference and classifies each difference as geometric (line, arc, circle), textual (dimension, note, label), or symbolic (GD&T, surface finish, weld symbol).
Dimension Extraction and Comparison. Every dimension on both drawings is extracted using a combination of OCR and geometric analysis. The system identifies the dimension value, tolerance (if specified), the geometric features being dimensioned, and the unit of measure. Changed dimensions are flagged with the old and new values, the absolute change magnitude, and the percentage change. For a drawing with 200 dimensions, this analysis takes under 45 seconds and catches dimensional changes that a human reviewer would need 2-3 hours to systematically identify.
GD&T Analysis. Geometric dimensioning and tolerancing frames are parsed according to ASME Y14.5 and ISO 1101 standards. The system identifies the geometric characteristic, tolerance value, material condition modifier, and datum references for each GD&T callout. Changes to any element of a GD&T frame are flagged — including changes that are semantically significant but visually subtle, such as switching from MMC to RFS or changing datum precedence.
Note and Annotation Comparison. All text annotations — general notes, flag notes, material callouts, process specifications, and revision descriptions — are extracted and compared between revisions. Added, removed, and modified notes are identified with their locations marked on the drawing. The system also checks for common annotation errors such as references to non-existent detail views, orphaned flag notes, and inconsistent material callouts between different views.
View-Level Comparison. The system identifies each view on the drawing (front, side, top, section, detail, isometric) and compares corresponding views between revisions. This view-level analysis catches changes in view arrangement, scale, and projection that might indicate a significant design modification not reflected in dimension changes.
How Does P&ID Cross-Validation Prevent Specification Mismatches?
DrawingDiffs third comparison engine addresses one of the most costly error categories in equipment design: inconsistencies between the P&ID specification and the physical design implementation.
The P&ID cross-validation operates bidirectionally:
P&ID to Assembly Check. Every component on the P&ID is verified against the assembly BOM and 3D model. The system checks that:
- Every P&ID component exists in the assembly (no missing components)
- Component types match (a P&ID globe valve symbol corresponds to a globe valve part, not a ball valve)
- Connection sizes match between the P&ID specification and the actual component
- Flow directions are consistent between the P&ID and the assembly tube routing
- Instrument tag numbers on the P&ID match the labels in the assembly
Assembly to P&ID Check. Conversely, every component in the assembly is verified against the P&ID to ensure nothing was added to the design that is not in the specification. Unauthorized additions — extra valves, unspecified bypass lines, non-standard components — are flagged for engineering review.
The cross-validation achieves 96.8% accuracy on standard P&ID symbology. For custom symbols used by specific companies, accuracy reaches 94% after a brief symbol training process (typically 2-4 hours of engineer-supervised symbol mapping).
In one documented case, the P&ID cross-validation detected that a gas panel design was missing a check valve that the P&ID specified on the hydrogen delivery line. The missing check valve would have allowed potential backflow of hydrogen into the gas cabinet — a safety-critical omission that had passed two rounds of manual design review. The estimated cost of detecting this error in the field rather than at the design stage: $150,000-300,000 including equipment modification, requalification, and potential regulatory reporting.
What Does the DrawingDiff Output Report Look Like?
The comparison output is designed for rapid engineer review. The report includes:
Executive Summary. A single-page overview showing total changes detected (categorized as critical, major, minor, and cosmetic), comparison with the revision notes (changes detected but not documented, and documented changes not detected), and an overall risk score for the revision.
Interactive Difference Map. A web-based viewer that displays both drawing revisions with all detected changes highlighted and annotated. Engineers can toggle between overlay mode (both revisions superimposed with differences highlighted), side-by-side mode (synchronized panning and zooming of both revisions), and list mode (a tabular list of all changes sortable by type, severity, and location).
Change Detail Cards. Each detected change has a detail card showing the before and after values, the location on the drawing, the severity classification, and any applicable standards references. Engineers can mark each change as reviewed, accepted, or flagged for further investigation.
Audit Trail. Every comparison session, review decision, and flag resolution is logged with timestamps and user identification, providing a complete audit trail for quality management system compliance (ISO 9001, AS9100).
The report format integrates with engineering change management workflows. For companies using Siemens Teamcenter or PTC Windchill, the DrawingDiff report can be automatically attached to the ECO as a verification artifact, eliminating the need for manual report management.
What ROI Should Equipment Companies Expect From DrawingDiff?
The return on investment for DrawingDiff is driven by two factors: time savings in the review process and cost avoidance from improved error detection.
Time savings. A 40-sheet drawing set comparison that requires 4-6 hours manually is completed in under 40 minutes with DrawingDiff (including engineer review of the AI-generated report). For a company processing 500 drawing revisions per year, this represents 1,500-2,500 hours of annual engineering time savings — equivalent to 0.75-1.25 full-time engineers.
Cost avoidance. The more significant ROI driver is preventing errors from reaching manufacturing and field installation. Using the industry benchmark that each additional percentage point of error detection at the design review stage prevents $50,000-150,000 in downstream costs annually, improving detection from 60% to 99% represents $2-6 million in annual cost avoidance for a mid-size equipment company.
Combined ROI. For a typical deployment at a semiconductor equipment company with 50-100 active design engineers and 500+ drawing revisions per year, the total annual benefit is $2.5-8 million against a platform cost that represents a fraction of this amount. Payback period: 2-4 months.
DrawingDiff does not replace engineering judgment — it ensures that engineering judgment is applied to the right questions. Instead of spending hours searching for what changed between revisions, engineers spend their review time evaluating whether the changes are correct. That shift from detection to evaluation is what transforms design review from a tedious obligation into an effective quality gate.
Still designing assemblies manually?
NeuroBox D converts your P&ID into a complete SolidWorks assembly — in hours, not days. See how it works with your own designs.
See how NeuroBox D converts P&ID to native SolidWorks assemblies in hours, not weeks.